


ZuluGIS is a framework for mapping, modeling utility networks and developing GIS applications
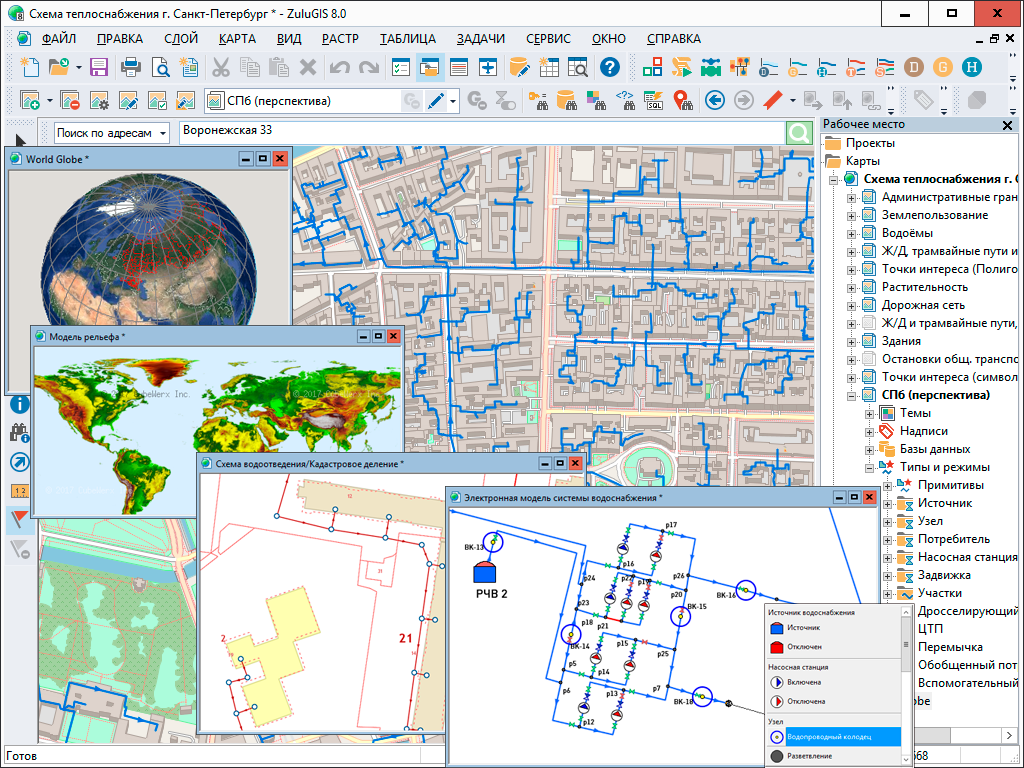
As a geographic information system, ZuluGIS provides the toolset for developing GIS apps that require spatial data visualization in vector and raster formats, analysis of their topology and connection with semantic databases.
With ZuluGIS, you can create various map projections and layouts, including utility network maps and diagrams, work with numerous raster objects, conduct simultaneous semantic and spatial analysis of graphics and tabular data, produce miscellaneous thematic maps, export and import data.
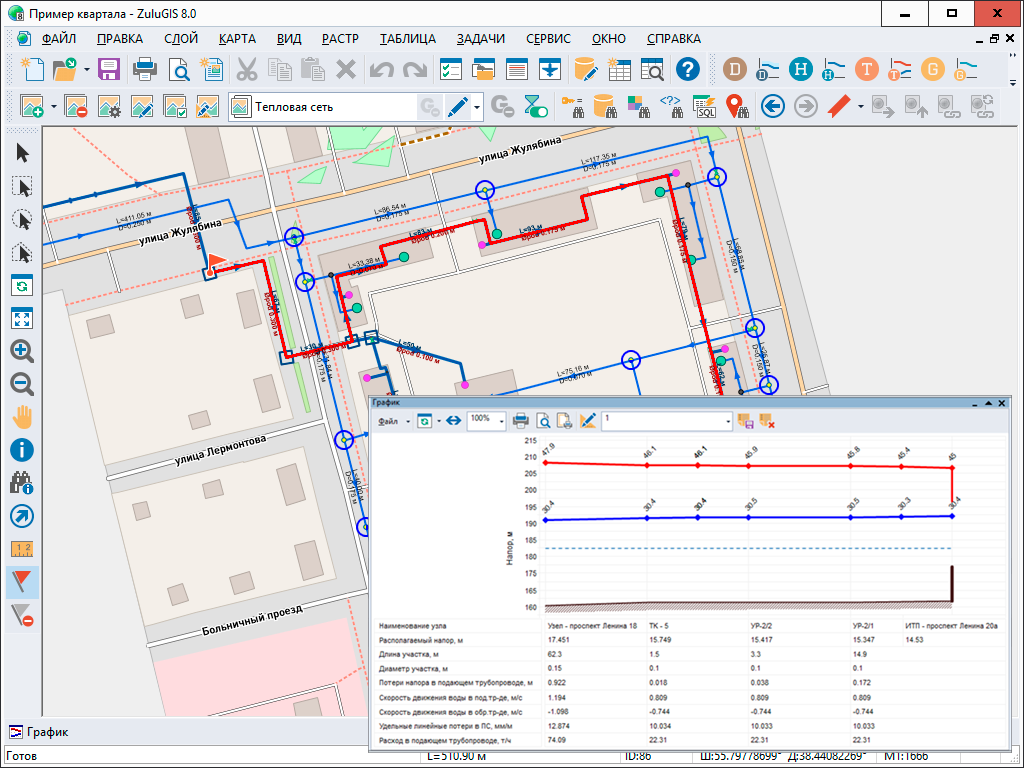
What sets ZuluGIS apart is its capacity for creating utility network diagrams with supported topologies. This feature makes it possible to use in-built modules for completing hydraulic calculations and building piezometric graphs.
Geographic information system ZuluGIS can operate as a fully-functional workstation in single-user mode, or as a ZuluServer client in multi-user mode, with all the functionality of the desktop app.
Data Layering
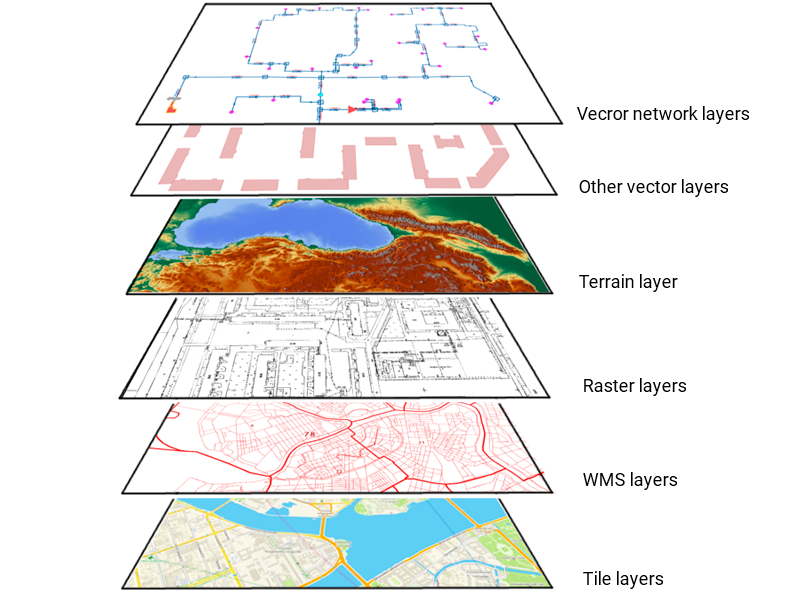
In ZuluGIS, graphic data is organized by layers. The system supports the following types of layers:
- Vector layers
- Raster layers
- Terrain layers
- WMS and WMTS layers
- Tile layers
Map layers can be located on a computer or, alternatively, on ZuluServer or third-party servers as one or several of their layers, as is the case with WMS and Tiles.
Vector Data
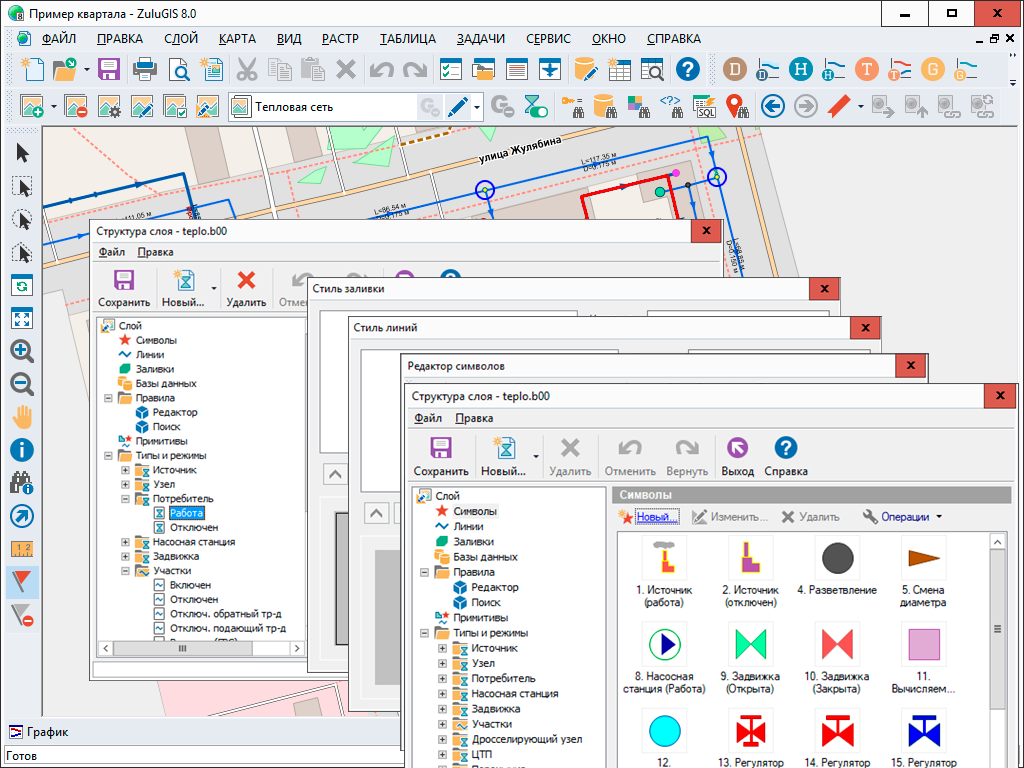
ZuluGIS works with the following vector graphic types: point (symbol), line, polyline, poly-polyline, polygon, poly-polygon, and text object. Symbol, line style and fill style editors enable users to set their own parameters for displaying objects.
A vector layer may contain objects of different graphic types.
To organize layer data, you can create classifiers that will group vector data according to type and mode. Every data type inside a layer can have its own semantic database.
To georeference raster data, you need to align it to control points manually or in the map popup window. Linked objects can be imported from Tab (MapInfo), Map (OziExplorer) and georeferencing ESRI world files.
Raster Data
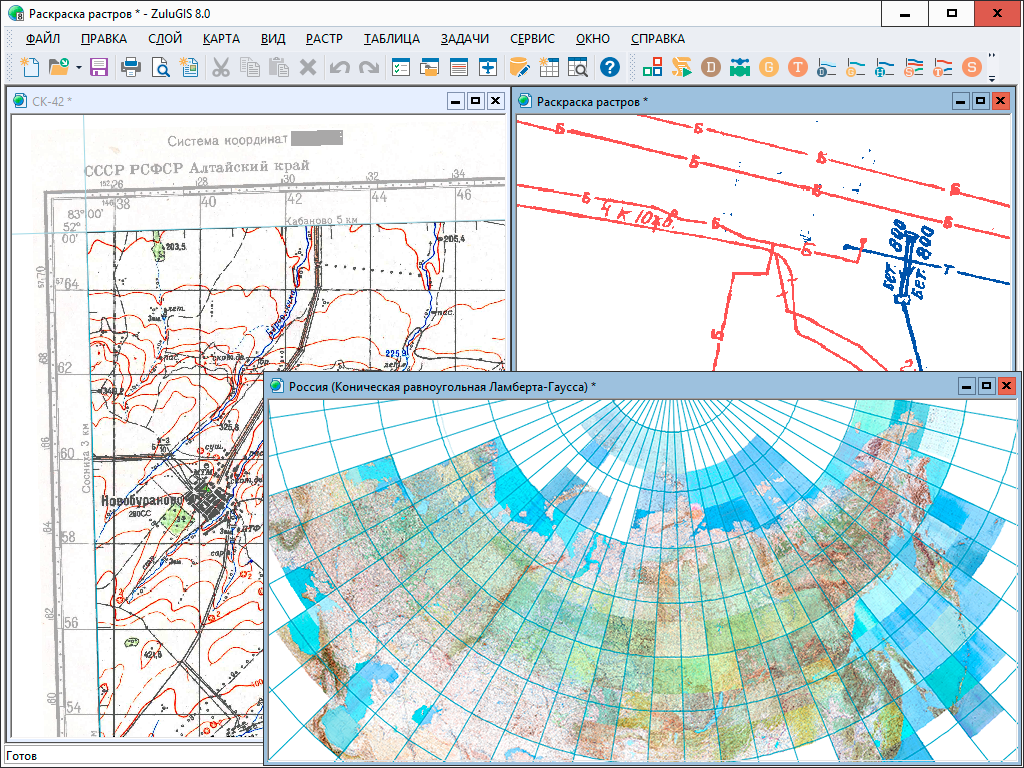
ZuluGIS makes it possible to work with thousands of raster objects simultaneously.
To georeference raster data, you need to align it to control points manually or in the map popup window. Linked objects can be imported from Tab (MapInfo), Map (OziExplorer) and georeferencing ESRI world files.
Methods for raster correction include rubbersheeting, affine transformation, and second-order polynomial transformation.
Users can set a visible area; remove marginal information without transforming raster.
When displaying raster objects on a map projection, other than the one to which raster data is georeferenced, raster points are re-projected instantaneously.
Working with Map Projections
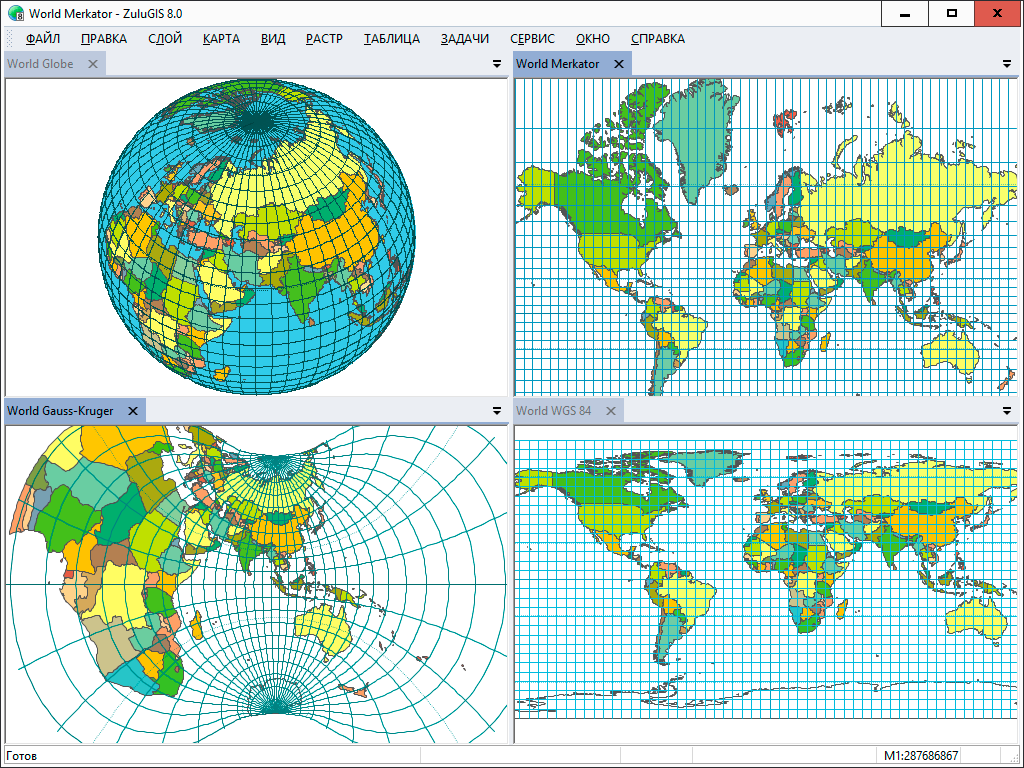
ZuluGIS can operate in a local coordinate system (layout), a geographic coordinate system (latitude/longitude) or on one of the map projections. You can see the list of currently supported projections here.
The system supports more than 180 datums (geographic coordinate systems), including PZ-90, SK-42, SK-95 under GOST R 51794-2001, WGS 84, WGS 72, Pulkovo 1942, NAD27, NAD83, and EUREF 89. The list of supported datums will expand with time.
ZuluGIS offers a set of predetermined coordinate systems. Moreover, you can set your own coordinate system with individual parameters for projections supported by the system. Among other things, this feature will make it possible to link data stored in a local coordinate system to other global systems, provided the projection parameters are known.
Data stored in different coordinate systems can be displayed on a single map on one of the projections. In this case, if required, coordinates from one datum can be transformed into another datum and from one projection onto another projection directly upon display.
Data can be re-projected from one coordinate system into another.
Semantic Information
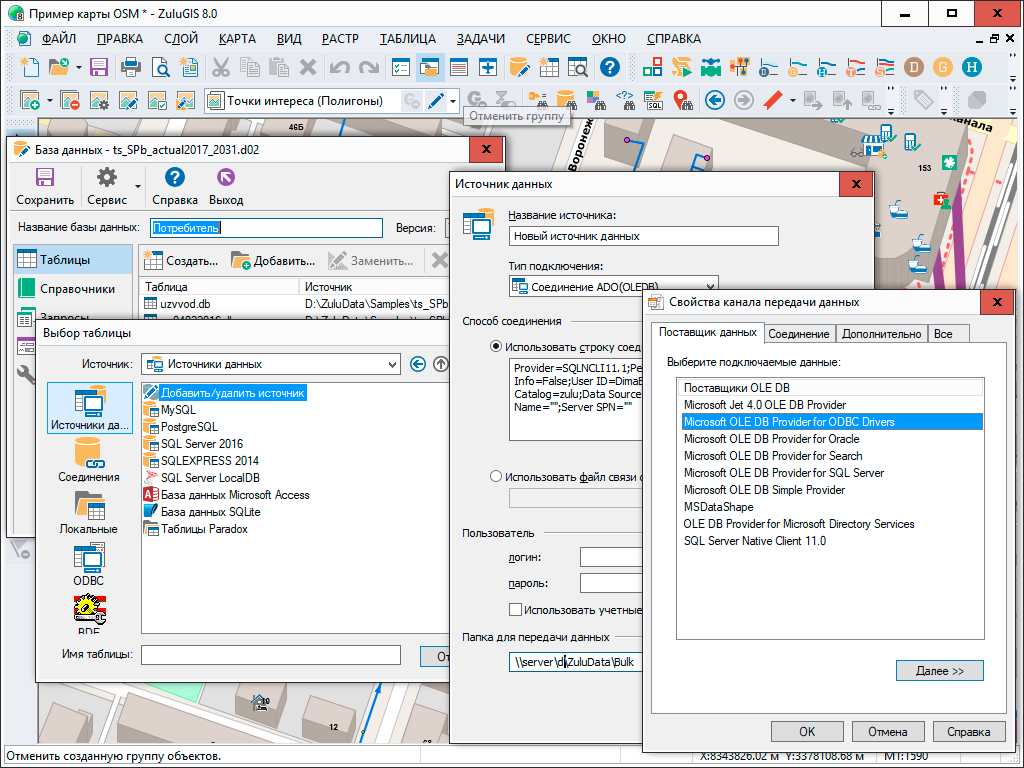
Semantic data can be stored in Microsoft SQL Server LocalDB, SQLite, Microsoft Access, Microsoft SQL Server, Oracle, MySQL, Sybase databases and other ODBC or ADO sources.
To facilitate access to semantic data, ZuluGIS offers its own ‘data sources’. Similar to ODBC DSN data sources or OLEDB UDL data links, these data sources can be used when adding tables to databases or selecting tables for other operations.
Data sources can be used locally in single-user Zulu app as well as on ZuluServer, where they can be shared with other ZuluServer users.
Read more about working with semantic data here.
Spatial Queries
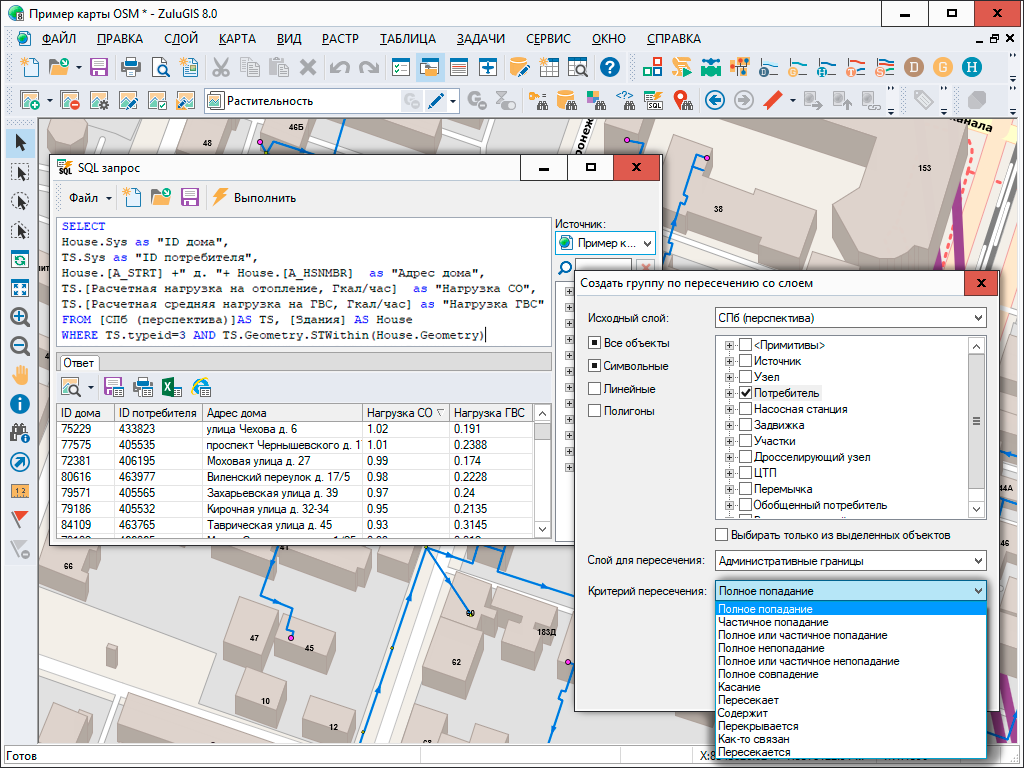
ZuluGIS makes it possible to analyze data, including spatial input (geometry, area, length, perimeter, object type, mode, color, text, etc.).
The system enables its users to make random selections of data according to set parameters with an option to highlight objects, save results in tables, and export them into Microsoft Excel.
Spatial queries can simultaneously include both graphic and semantic data related to different layers.
Queries can be formed directly on a map, in popup windows with semantic information, special dialogue-based query generators or as SQL queries using OGC extension.
Learn more about spatial queries here.
Network Modeling and Topology Tasks
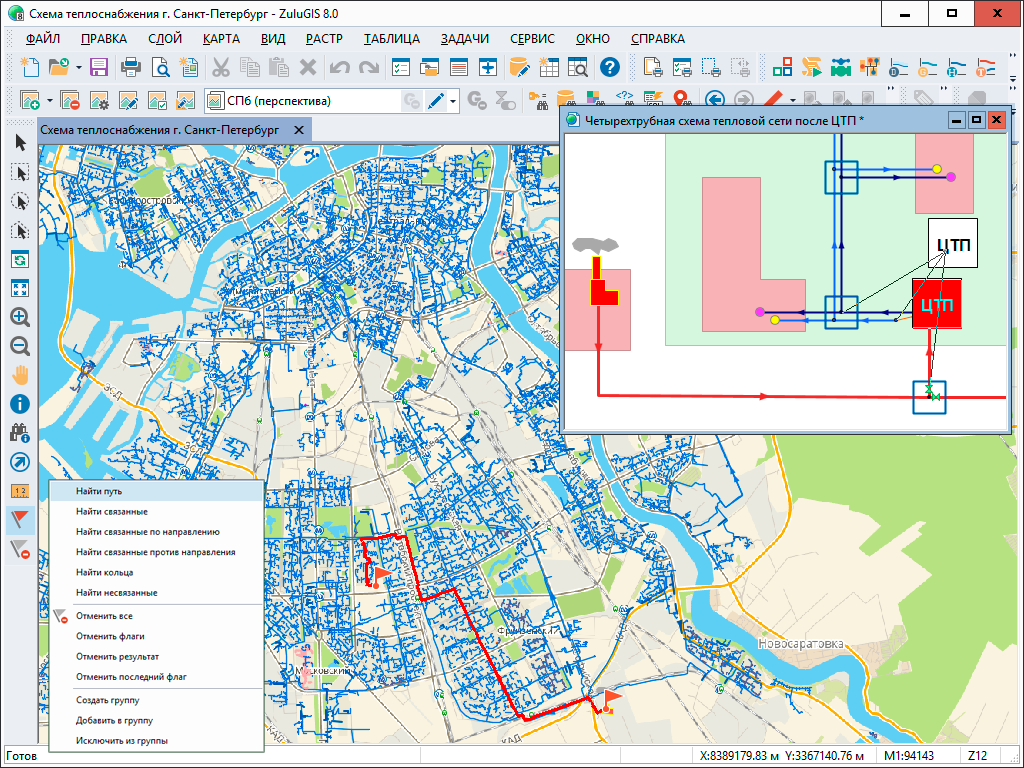
Along with ordinary GIS division of objects into contours, polylines and symbols, ZuluGIS supports linear-nodal topology, which allows users to build models for utility systems and other networks.
A topological network model is a network graph, whose nodes are zero-dimensional objects (wells, sources, gate valves, knife switches, intersections, consumers, etc.), while its edges comprise of linear objects (cables, pipelines, sections of road networks, etc.).
Topology editor builds a network graph model directly in the process of entering (drawing) graphic information.
By using a network model, you can complete a number of topology tasks, such as discover the shortest path, analyze connectivity, loops and shutdowns, and find shut-off devices.
ZuluGIS network model serves as the framework for our utility network calculation modules: ZuluThermo, ZuluHydro, ZuluDrain, ZuluGaz, ZuluSteam.
Terrain Modeling
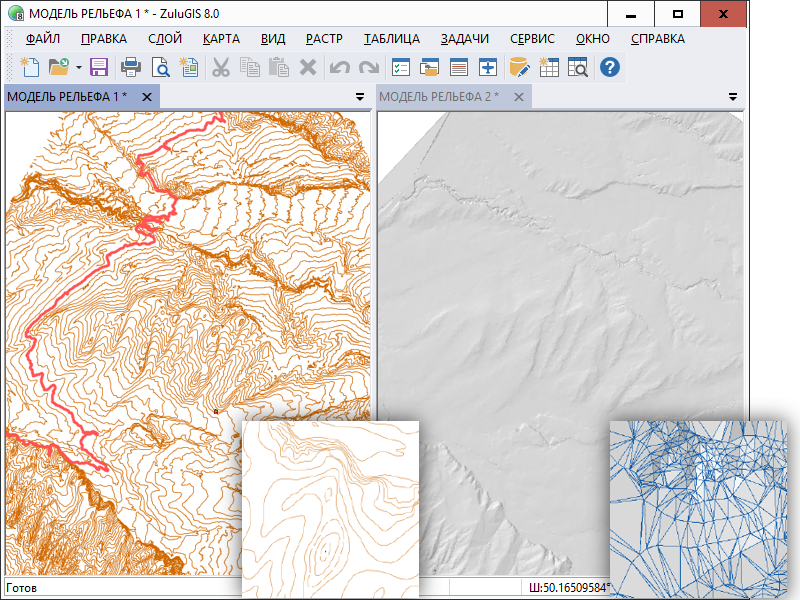
ZuluGIS allows users to build elevation models. Input data for building a terrain model includes layers with contours and elevation points. This data is then used to create a triangulation (a Delauney triangulation, with limitations, taking contours into account), which is saved as a special type of layer (an elevation layer).
Having a terrain model makes it possible to complete the following tasks:
- Determine terrain elevation anywhere within triangulation, estimate surface areas and scope of earthworks for specified territories, create contours with set contour intervals, construct flood zones, elevation rasters and profile graphs for arbitrarily assigned pathways.
- Display terrain layers in different ways: triangular mesh, hill-shading with specified direction, altitude and angle of illumination, aspect, and slope.
- Set up automatic data input according to elevation points in all utility system modeling modules (ZuluThermo, ZuluHydro, ZuluDrain, ZuluGaz, ZuluSteam).
Learn more about terrain modeling here.
Pseudo-3D Mode
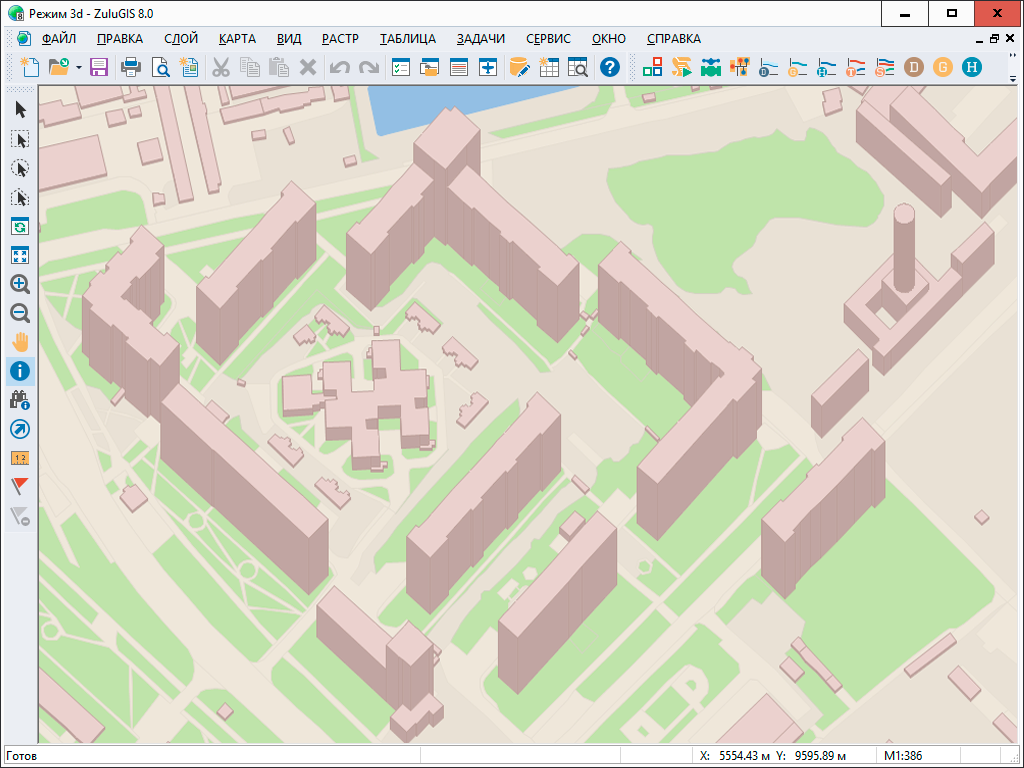
In this mode, polygonal objects are displayed as prisms, whose lateral faces are proportional to a specified height.
To set a height value in meters or number of floors, use an appropriate entry field in the semantic database.
You can adjust object angles, coloration of lateral faces and edges.
Read more here.
Printing ZuluGIS Maps
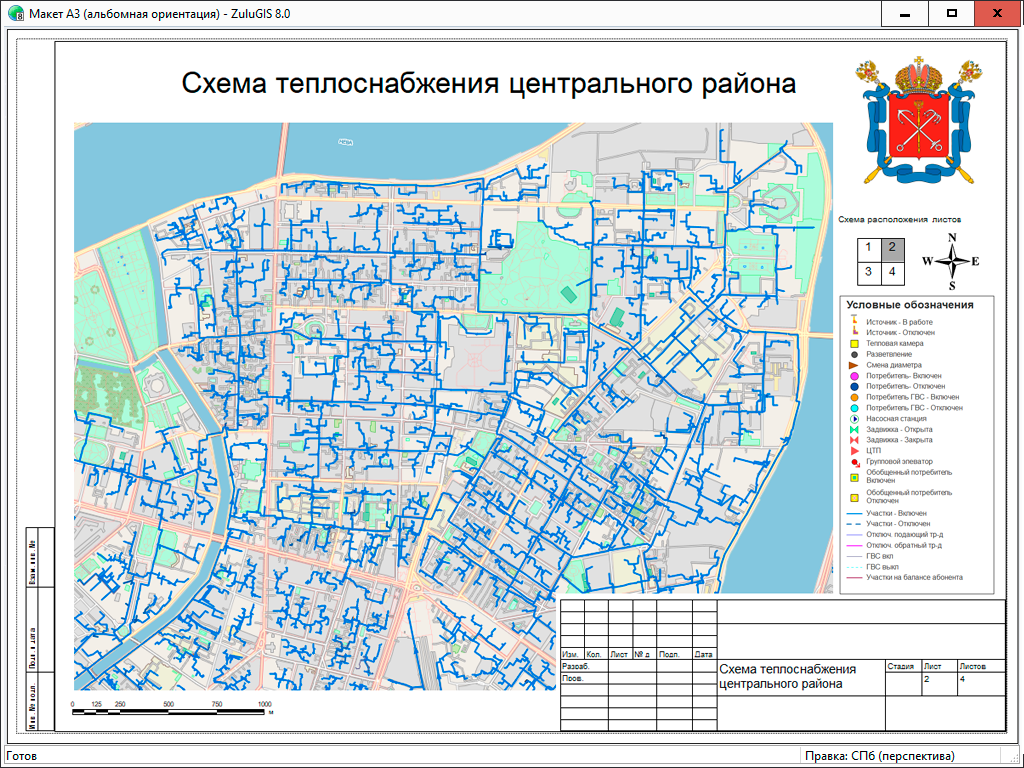
Map printing requires adjusting different settings, such as print layers, printing area, scale, number of pages, format and page orientation. Learn more about print settings here.
In addition to printing ZuluGIS maps based on print settings, you can also create print forms using print layouts.
With print layouts, users are able to put together print documents that include maps, texts and graphics. Layouts can be incorporated into Zulu maps, stored as separate layout files or converted into PDF.
Data Import and Export
ZuluGIS imports vector data from DXF (AutoCAD), Shape (ArcView), Mif/Mid (MapInfo), GeoJSON, KML (Google) and GIS data saved as a text file. In case of Shape, Mif, GeoJSON, KML and text, data is imported along with attribute databases, based on a geographical projection.
Vector data is exported into DXF (AutoCAD), Shape (ArcView), Mif/Mid (MapInfo), KML (Google). Data is exported into Shape, Mif and KML along with attribute databases, based on a geographical projection.
Raster objects are imported and exported into Tab (MapInfo), Map (OziExplorer), Map (OziExplorer) and ESRI World File (ArcGIS).
Moreover, you have the option to use ZuluGIS object model to create your own converter.
Learn more about supported data formats here.
WMS and WMTS Web-Services
ZuluGIS allows users to receive and add to a map spatial data from web servers that support Web Map Service (WMS) and Web Map Tile Service (WMTS) specifications developed by Open Geospatial Consortium (OGC).
WMS and WMTS data is added to the system as special ZuluGIS layers (WMS and WMTS layers). These layers can be displayed on a map in various combinations with other layers.
Read how to add WMS and WMTS data to ZuluGIS here.
Tile Servers
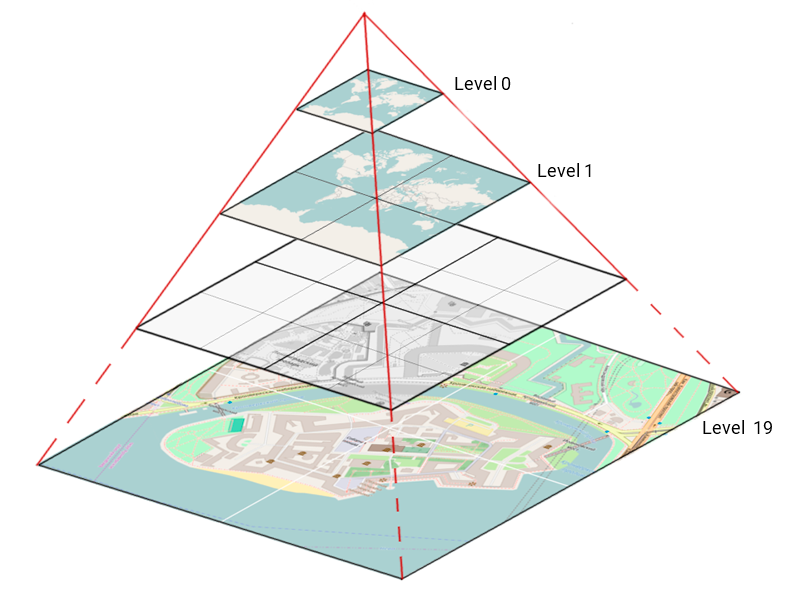
Many GIS servers, such as Google Maps, OpenStreetMaps, Wikimapia, Yandex.Maps, are able to offer mapping information as raster images cut into small parts – tiles. Together these tiles form an image of an entire territory at several fixed scales. All tiles at the same scale make up a level. That is, every tile at one level is represented by four tiles at the next level. The sum of all tiles at all levels constitutes a tile system.
ZuluGIS provides functionalities for using mapping data from such tile servers as map layers.
Read more about working with tile servers here.
Extension Modules And GIS Component Library ZuluXTools
We have designed ZuluGIS system to work with both our extension modules and user-generated programs.
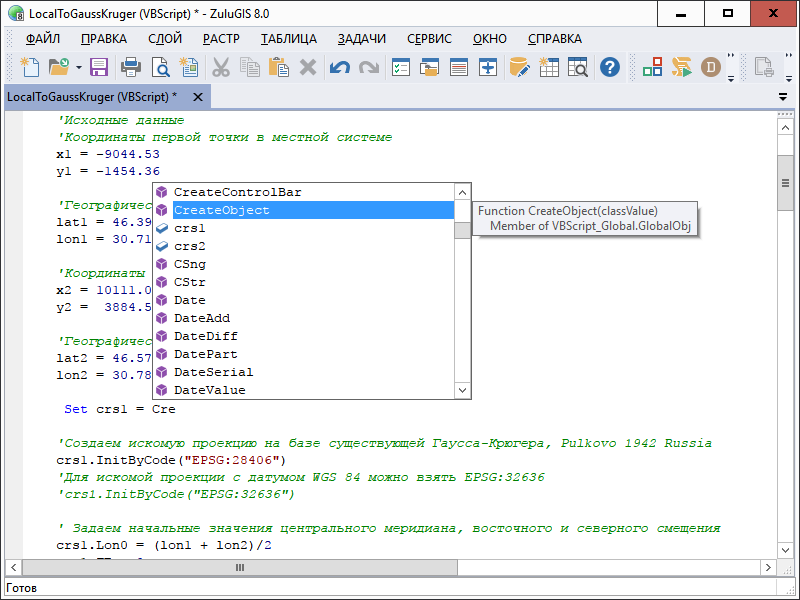
Plug-in architecture (additional embeddable modules or system extension modules) makes it possible to use ZuluGIS as a GIS platform (or GIS environment) for running other applications, something that we have already done with heat and water supply calculations. ZuluGIS also provides opportunity to create macros using Visual Basic Script (VBScript) and Java Script (Jscript) programming languages. For faster access, users can assign macros to new control buttons in the toolbar.
COM-based object model is used to facilitate communication between extension modules, scripts, ZuluGIS system and layer data. You can see the object diagram here.
Employing the same object model, users can integrate working with our data into their own applications with the help of ZuluXTools GIS component library.
ZuluGIS Calculations For Utility Networks
Our company has released ZuluGIS extension modules that include applications for hydraulic calculations for utility networks and a module for building piezometric graphs:
- ZuluThermo – modeling and analysis for heat networks
- ZuluHydro – modeling and analysis for water supply systems
- ZuluDrain – modeling and analysis for wastewater disposal systems
- ZuluGaz – modeling and analysis for gas networks
- ZuluSteam – modeling and analysis for steam pipelines
See also: Hydraulic calculations for heat networks; GIS server (multi-user mode)