Hydraulic shock
Purpose
The goal of modeling is to determine the sections and nodes of a network that are subjected to an impossible high or low pressure during a transient event. The events that trigger a transient response include turning pumps on and off, opening or closing gate valves as well as pipe ruptures. Intensive processes lead to immediate destruction (hydraulic shock, also known as water hammer), while less vigorous ones cause premature deterioration of network elements; this can result in an inflow of groundwater into a water supply system and phenomena associated with cavitation.
Minimizing the negative effects of transient events
- Find out causes and source locations of intensive transient events
- Outline measures to protect the network, for example, installing safety devices, replacing pipes
- Evaluate the effectiveness of planned measures
Modeling results for transient events in hydraulic networks
Network modeling utilizes models of safety devices and takes into account such developments as entrapped air in a pipeline or pipe rupture.
During modeling, users observe propagation of traveling pressure waves and velocity along a route. The modeling results are then used to build graphs of:
- pressure at each point along this route
- pressure vs. time for a number of selected observation points
The pressure values for each pipe and node of the network are entered into databases along with the time these pressures occurred; additionally, a corresponding location is specified for each pipe.
The following notifications can appear during the modeling process:
- liquid pump suction has failed
- maximum allowable pressure has been reached at a certain point in the network
With the help of ZuluGIS queries, users locate dangerous areas and nodes in the database, and then add other observation points and customize the route for plotting graphs on the basis of this information.
Interface
The program offers a user-friendly interface and allows users to perform calculations and modeling for big networks.
- Input networks
- Plot and print graphs
- Calculate starting conditions
- Monitor parameters
Example
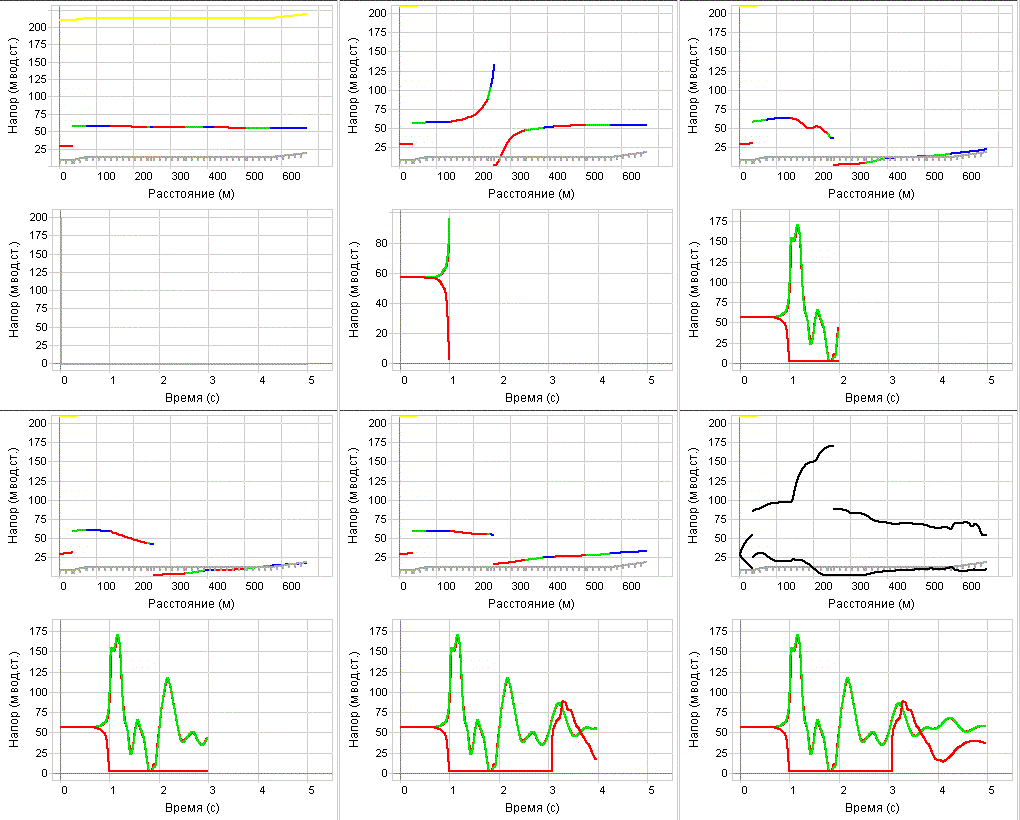
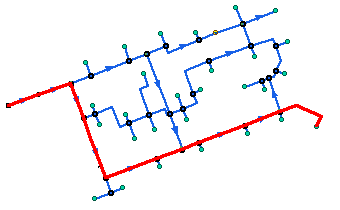
Here you can see some of the calculation results for transient responses in a water supply system, which in addition to pipelines includes a reservoir, a pumping station, multiple wells with gate valves, and numerous consumers.
In the beginning, water velocity did not exceed one meter per second. Transient events are triggered by closing a butterfly valve, which leads to pressure surges.

The upper graph shows pressure waves propagating along the selected route that passes through the closing gate valve, while the lower graph displays pressure changes in cross sections before and after the valve.

A schematic diagram of a water supply system used for modeling
These calculations require a license for simulation modeling, and should be performed only after you have completed simulation modeling!
See also: Network switching


