


BUILDING A PIEZOMETRIC GRAPH OF A WATER SUPPLY SYSTEM
ZuluHydro Online Help «Piezometric graph»
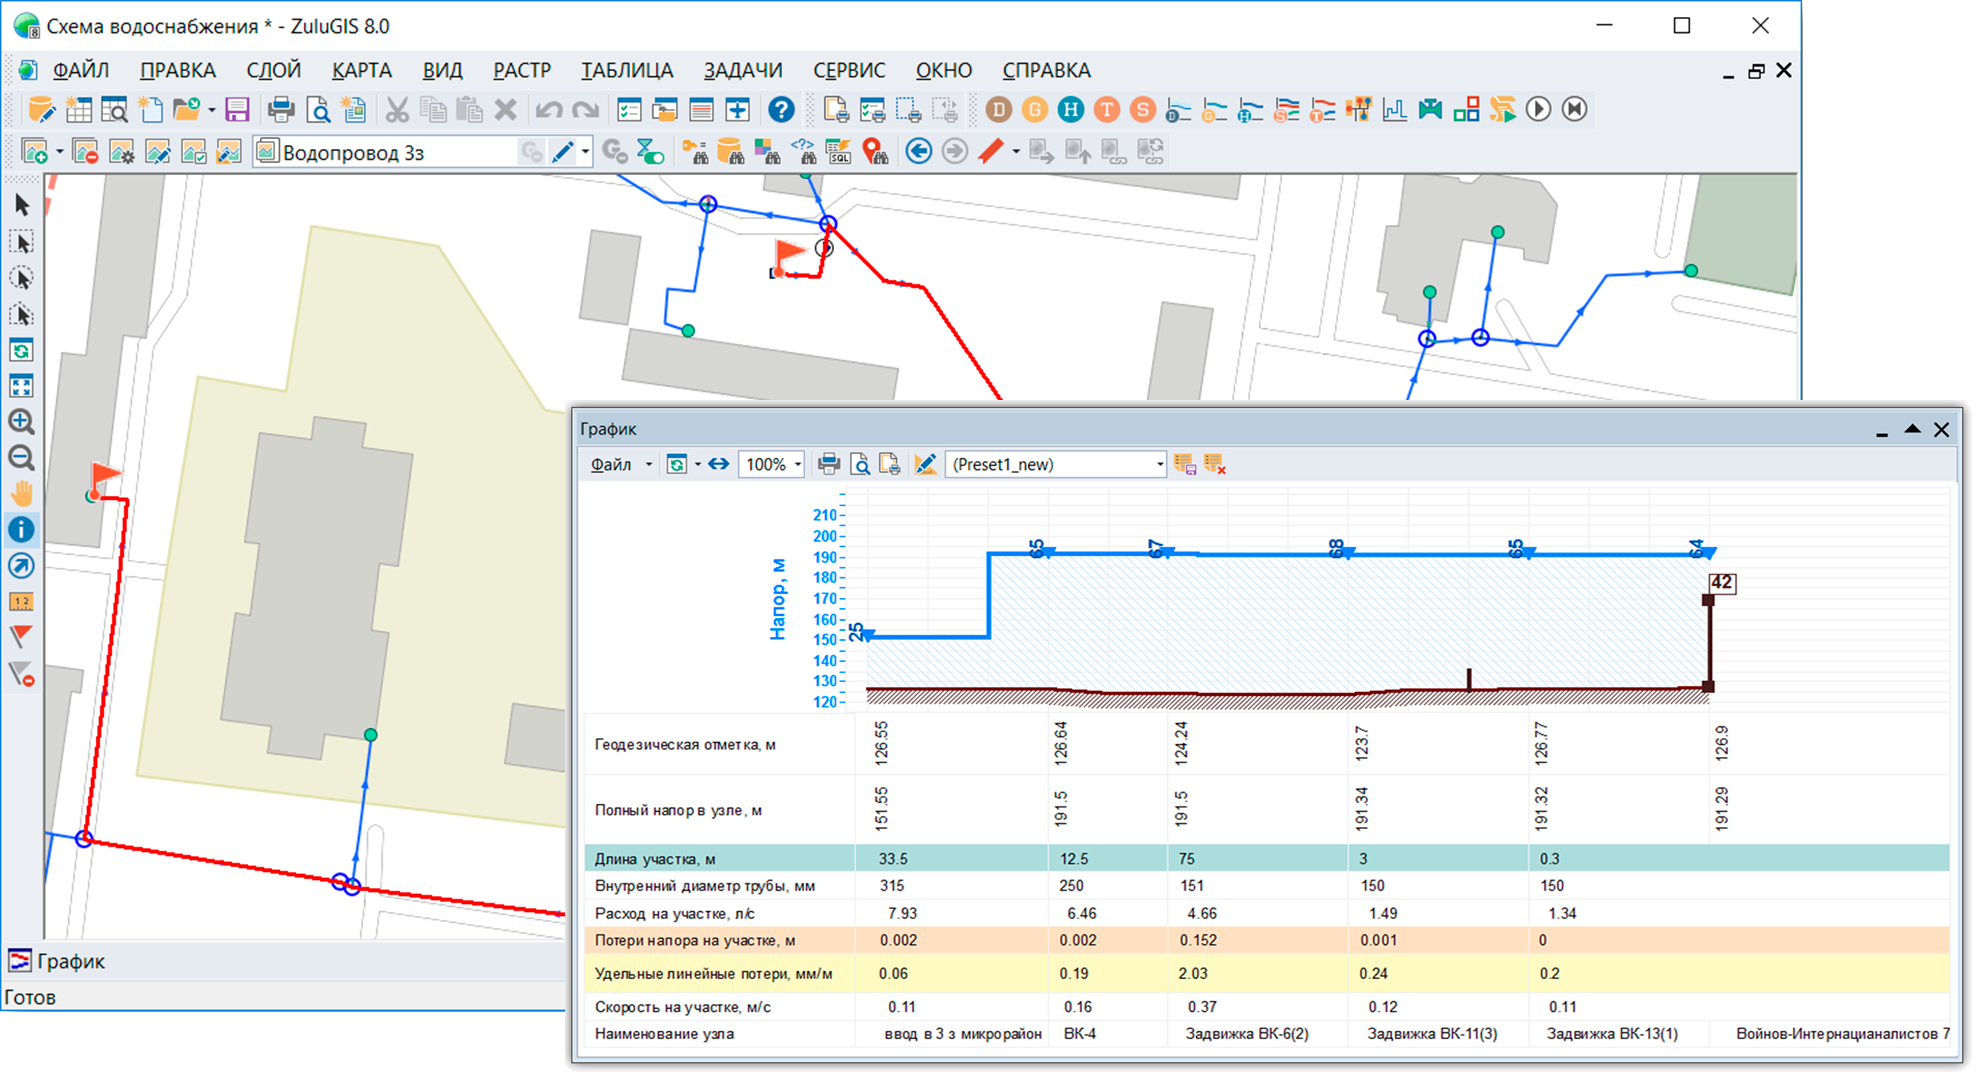
The purpose of building a piezometric graph is to illustrate the results of hydraulic analysis (pipe diameter calculations, simulation modeling).
A graph comprises the following elements:- pipeline pressure line
- ground line
- building height
- node name
- survey benchmark
- elevation at consumer location
- water velocity in sections of a water supply system
- head in supply and return pipelines