ZuluGIS Online — web client for ZuluServer
ZuluGIS Online is a web application for viewing and editing spatial data provided by ZuluServer web services. The app opens from a web browser and allows users to receive layer data, make search queries, display layer objects on a map, edit graphics and tabular information, view and upload various documents and images.
Its simple intuitive interface makes it possible to provide a wide range of employees with authorized access to ZuluGIS maps and digital models and enables all company specialists to instantly update existing cartographic materials
Spatial data opens with ZuluServer, enabling simultaneous access to up-to-date data in our ZuluGIS desktop app, ZuluGIS Mobile app, and ZuluGIS Online web app.
You can access ZuluGIS Online once you have installed ZuluServer 8.0. The client app opens from any web browser using the following address – «http://<host>:<port>/ZuluWeb/» where:
- <host> – ZuluServer address on the Internet
- <port> – server port number
- ZuluWeb/ – run command for ZuluGIS Online
ZuluGIS Online requires a ZuluServer Web Services license.
GRAPHICS EDITOR
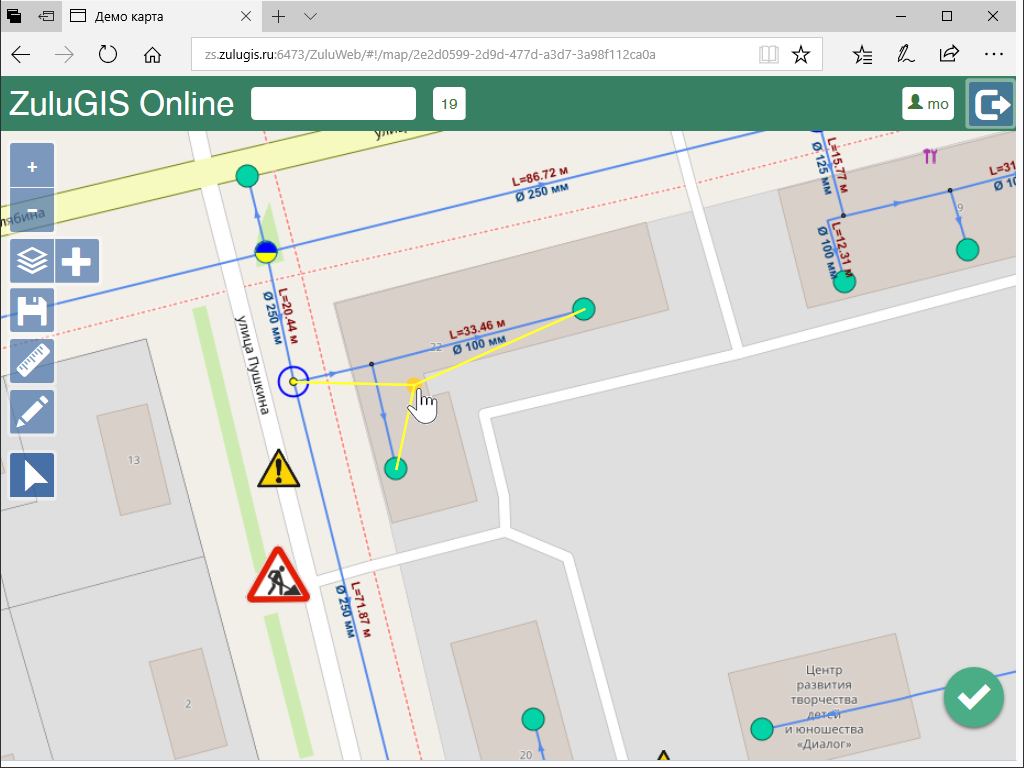
ZuluGIS Online has a user-friendly graphics editor that allows you to add new standard objects or edit the existing ones. The editor supports linear-nodal topologies and provides the tools to create interconnected networks.
Since structures, types and modes of layers as well as corresponding styles and symbols are created in ZuluGIS, users of the web application are not required to have any specialized skills..
INFORMATION ACCESS
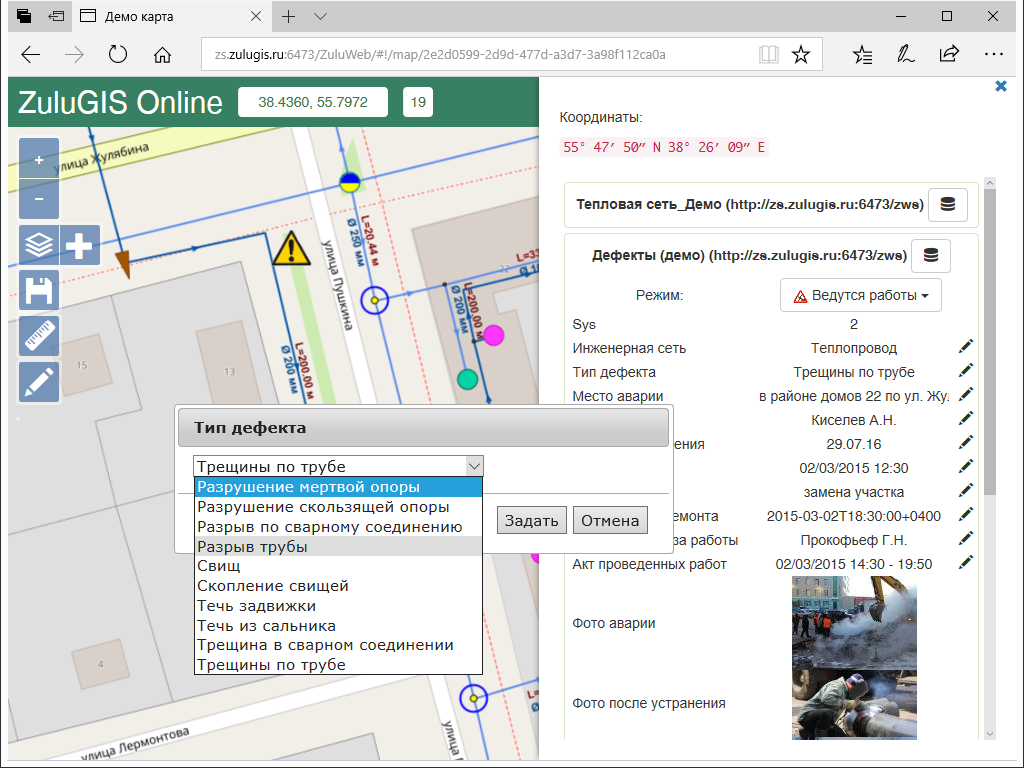
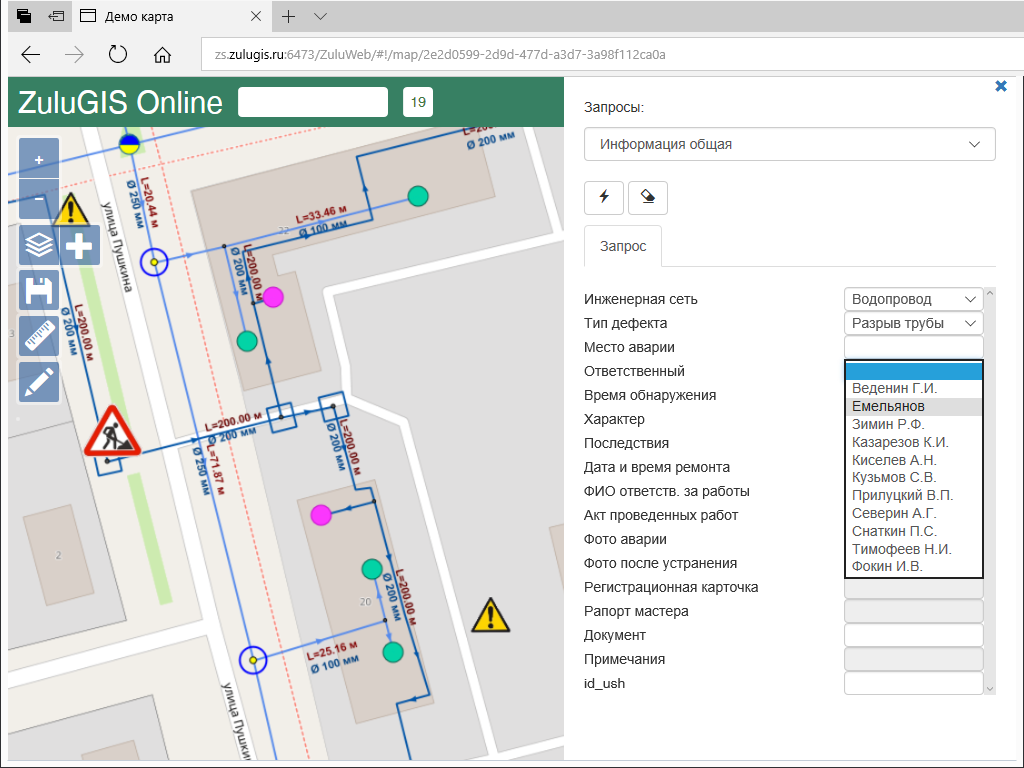
With ZuluGIS Online, you can view and modify information connected to layer objects. The tool for creating directories and the in-built calendar for specifying date and time considerably speed up the process of entering information and eliminate any potential errors.
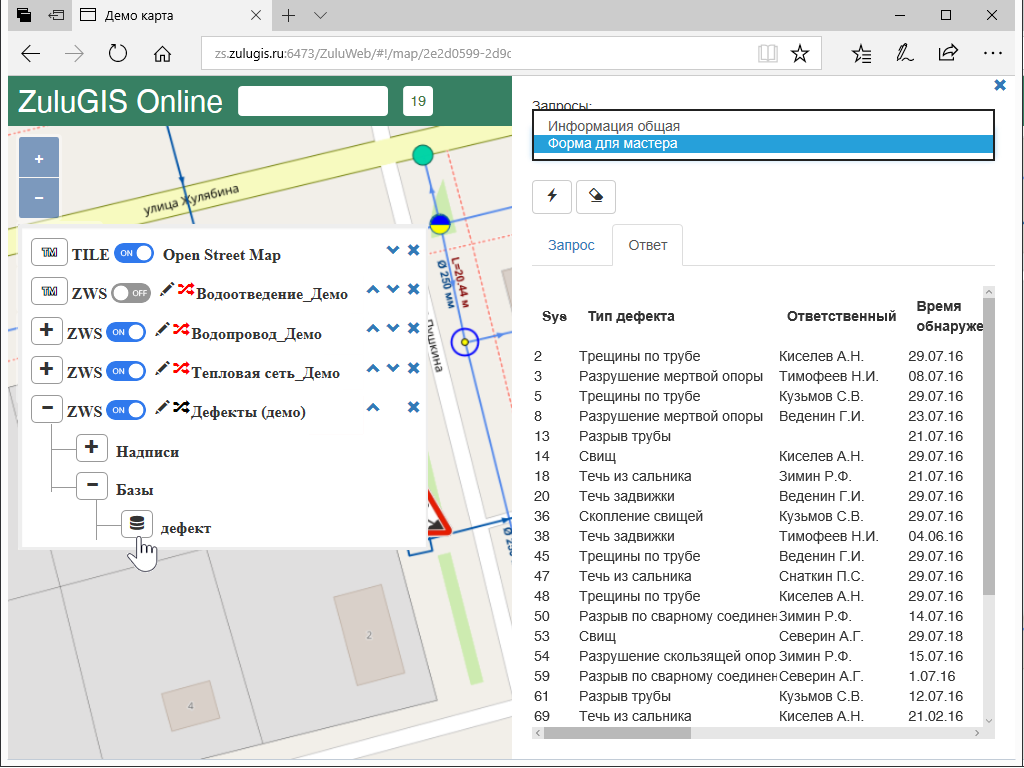
It is possible to access information on all objects of a specific type in tabular format. To find objects of interest or select objects according to certain criteria, you can make search queries and highlight search results on the map.
DATA VISUALIZATION
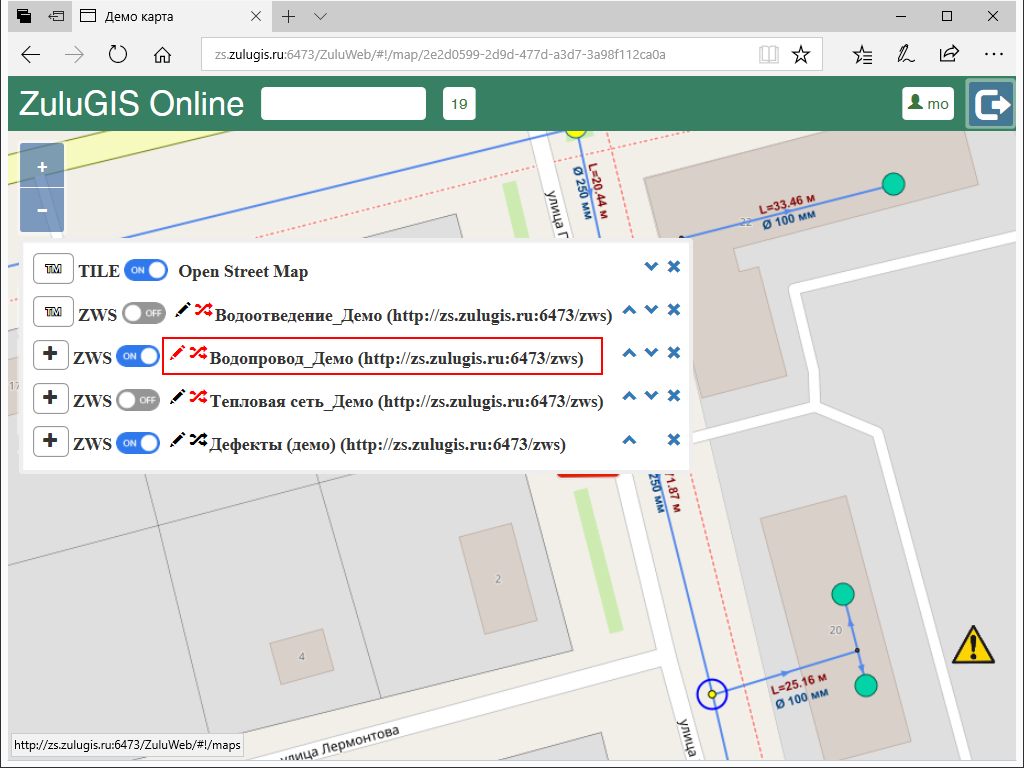
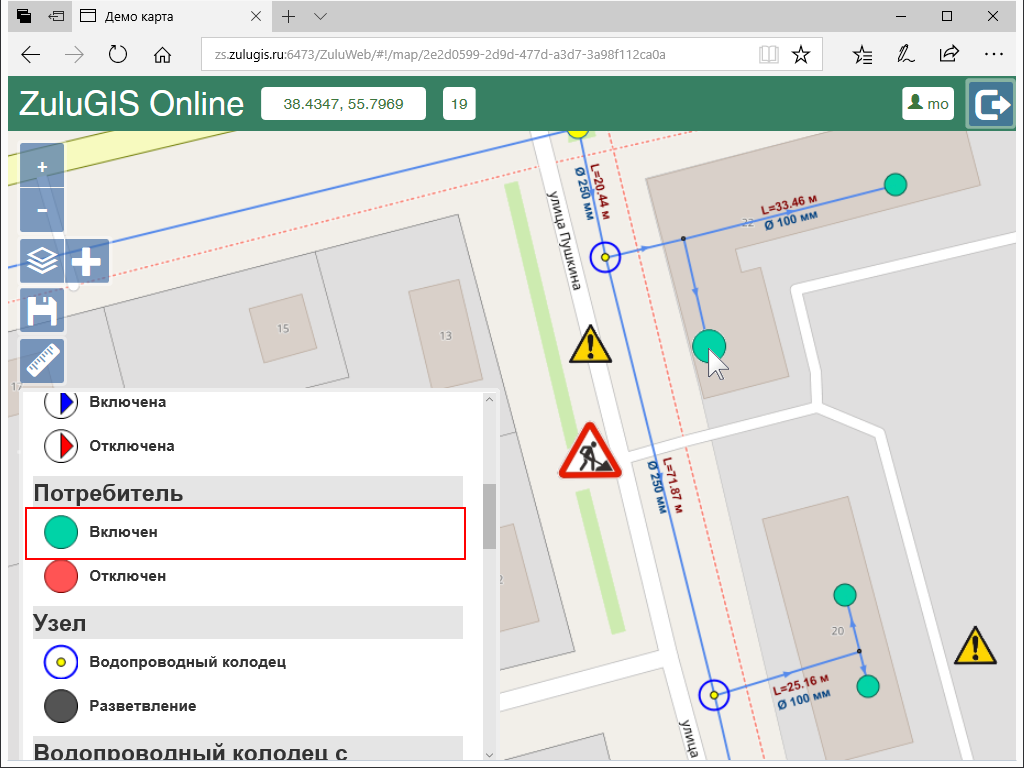
ZuluGIS Online provides its users with an extensive set of tools for visualizing data, enabling them to analyze information and swiftly make the right decisions. It is possible to display tabular data as labels on a map, add coloring, and show flow direction for separate segments of utility networks.
All tools can be configured in ZuluGIS and do not require any specialized knowledge from users of the web app.
ANALYSIS OF NETWORK TOPOLOGY
Just like our ZuluGIS desktop application, ZuluGIS Online web app supports linear-nodal connectivity and enables users to complete a number of topology tasks.
In ZuluGIS Online you can:
-
• Analyze switchovers
• Find shut-off devices
• Discover the shortest path
• Analyze cohesion
• Analyze loops
DATA ADMINISTRATION
With ZuluServer, you can easily control how and who accesses data. Every user is given a username and password that determines the ways, in which they are allowed to handle information. The web application supports public mode, where users are not required to enter username and password to access data.
CUSTOMIZATION
Change the appearance of ZuluGIS Online by adding:
-
your own logo
-
custom CSS file
ZuluGISOnlineCustomLogo.png logo file and ZuluGISOnlineCustom.css document presentation description file are located in the folder where ZuluServer is installed.
A separate license is required for customization.
Get to know the web app
You can learn more about the functionalities of ZuluGIS Online on our demo server.
-
Username: mo
-
Password: mo


