


Building a piezometric graph
ZuluThermo Online Help «Piezometric graph»
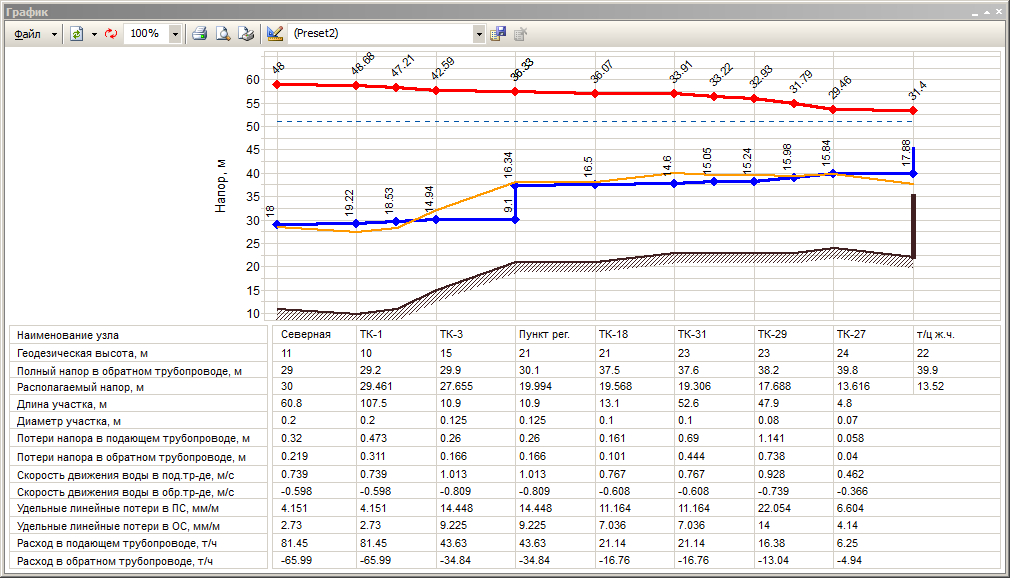
The purpose of building a piezometric graph is to illustrate the results of the hydraulic analysis and modeling (adjustment, simulation, diameter calculations).
A graph comprises the following elements:
- pressure line for supply piping
- pressure line for return piping
- geodetic height line
- head loss line for orifice plates
- building height
- boiling point line
- static head line
An accompanying table contains the description of each network node
- node name
- pressure head in supply and return piping
- head loss by heat network pipes
Users can configure the amount of information displayed under the graph, color and style of lines.
In order to illustrate network heat loss, ZuluThermo builds a «source – specified consumer» temperature drop graph.