


Gas Network Process Flow Diagrams: From Manual Work to Automation with the Process Flow Diagrams Module

The experience of Gazprom Gas Distribution Yoshkar-Ola in using ZuluGaz 2021, the Process Flow Diagrams module.
Since 2008, our company has been actively using a geographic information system (GIS) based on ZuluGIS. During this period, we have acquired a number of products: Gas Verification Analysis, Piezometric Graphs, ZuluServer Web Services, and Commutation Tasks. These solutions have become an integral part of our production processes.
Until September 2024, process flow diagrams were created manually, which took an enormous amount of working time. For example, completing one of the most complex diagrams took the staff of Gazprom Gas Distribution Yoshkar-Ola about a month and a half. The situation changed, however, after Mezhregiongaz LLC set conditions that ruled out the possibility of producing diagrams manually. As a result, we acquired the Process Flow Diagrams module.
Advantages of the Process Flow Diagrams module
The introduction of the new module was a real breakthrough. The time required to complete a diagram dropped from a month and a half to a few hours: from 5 minutes to 4 hours depending on complexity. Creating diagrams is now a job for a single employee, and the result exceeds expectations.
Earlier, in 2023, we had tested this module and shared our suggestions with the developers. Over the past year, the developers refined the functionality, and we now have a tool that fully meets our expectations.
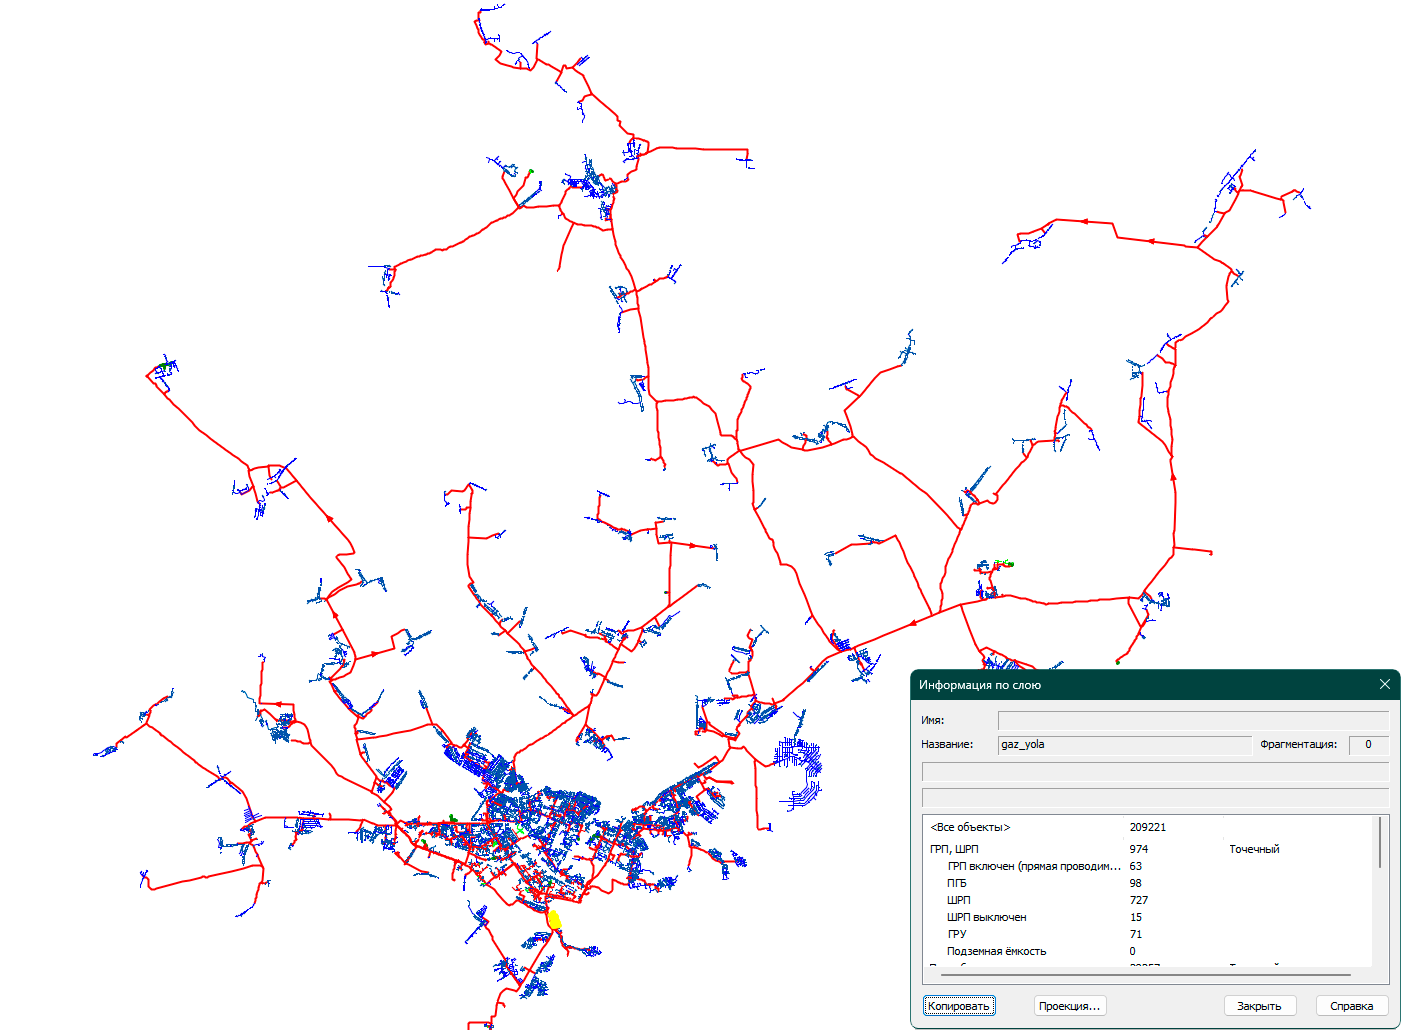
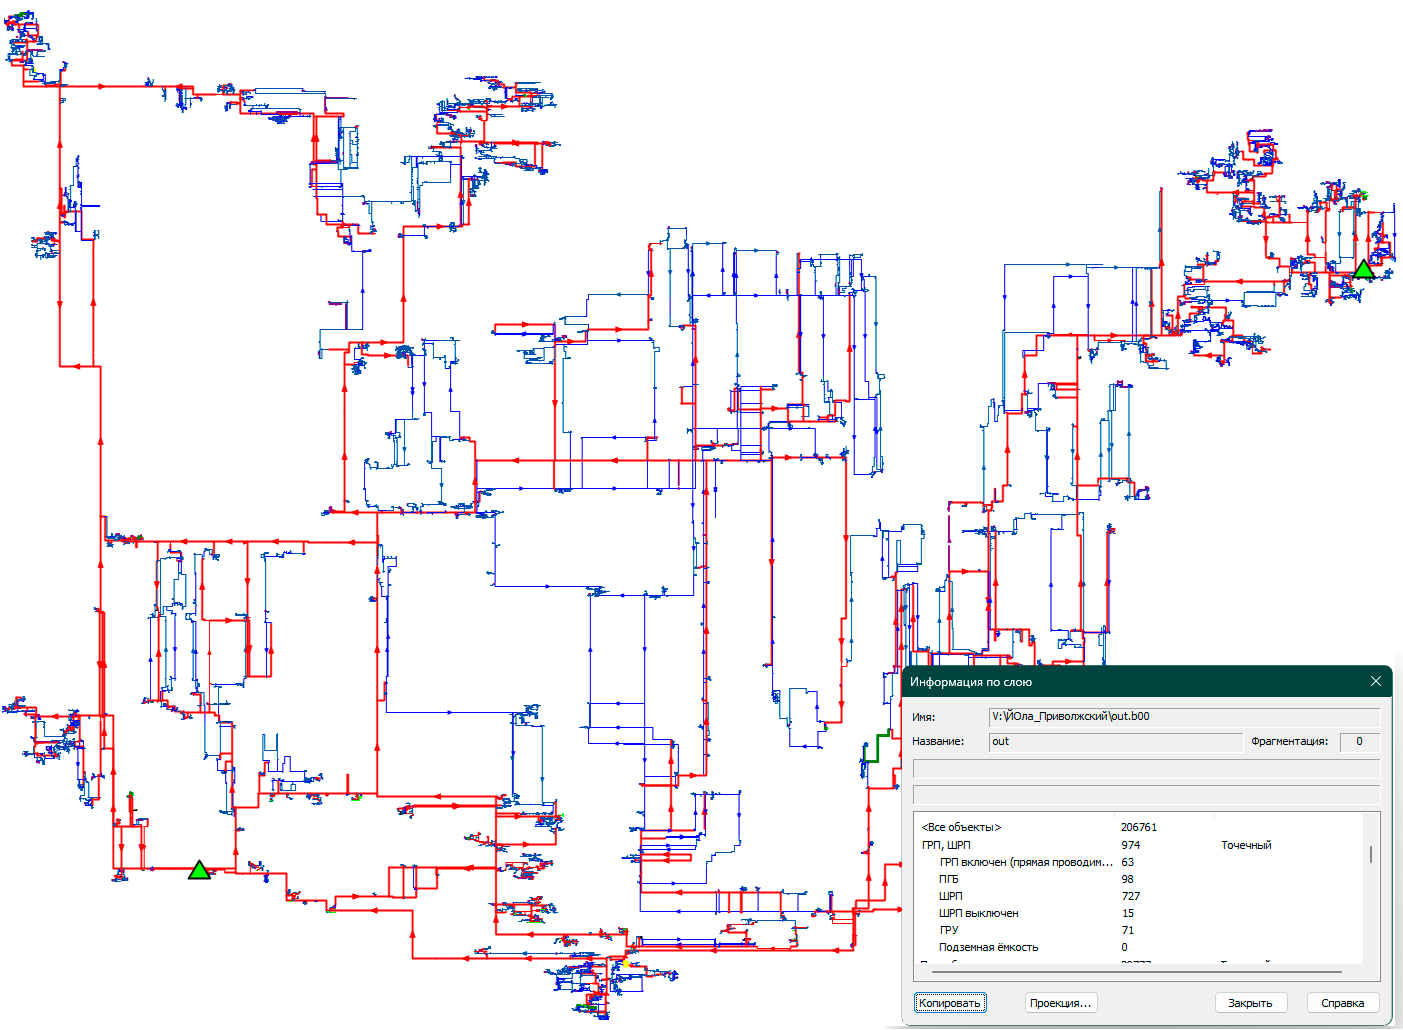
Among the key advantages of the module are:
- Automatic generation of diagrams from one or several ring-connected gas distribution stations (GDS).
- Easy conversion of data from the main map into process flow diagrams.
- Generation of diagrams from one or several ring-connected GDS.
- A significant reduction in the time needed to create and modify diagrams.
Thanks to these capabilities, our diagrams — which we had been unable to get approved for a year — were finally adopted by the parent organization.

Working with the module
Despite the obvious advantages, working with the module required taking a number of details into account, without which the diagram cannot be created:
- Maintaining the gas flow directions at the inlet and outlet of the gas pressure reduction stations (GPRS). This is very easy to verify simply by running the build.
- The tie-in angle of gas pipelines into the main gas pipeline must be at least 45 degrees. This is dictated by the technical specifics of making tie-ins, since a tie-in is in any case performed with a saddle fitting (for a PE pipe) or a "cup" coupling (for a steel pipe) at a 90-degree angle.
- A node may be linked to no more than 4 sections.
- No symbols should overlap with unconnected networks.
- All network elements must be connected to gas pressure reduction stations (GPRS).
- All labels in the layer must be scalable.
- Balance holders must be specified in the section database at the points where they change.
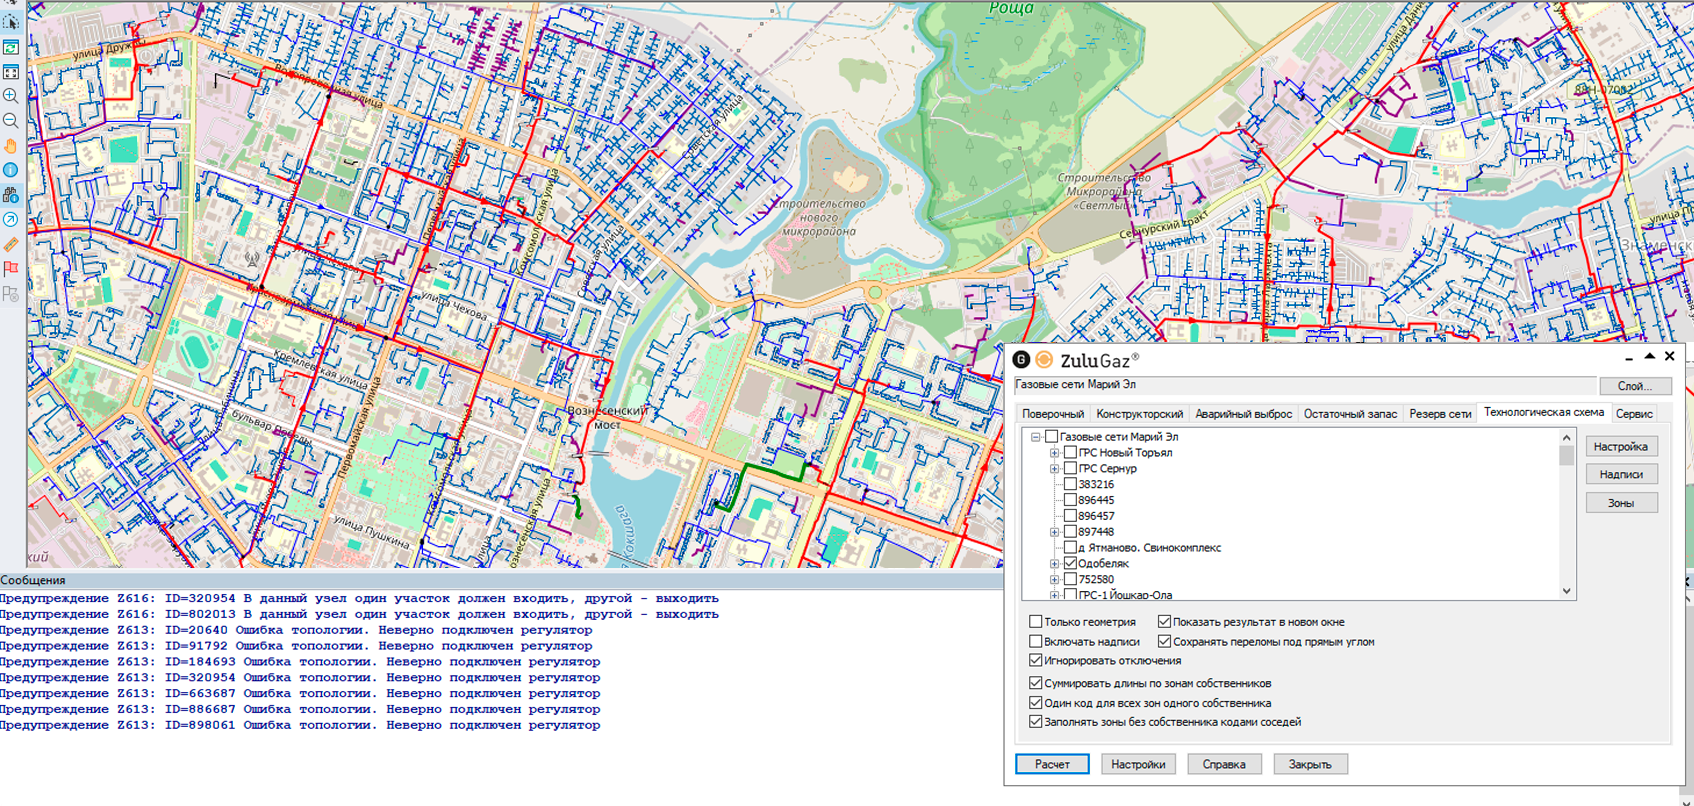
These points require a careful approach. Throughout our study of the software's functionality, the technical support team at Politerm demonstrated high expertise and patience, helping us successfully master the module.
The way the diagrams are laid out is also worth noting. When a diagram is built, the model is generalized: some network elements are excluded, yet the overall length remains unchanged. Object data is automatically carried over to the diagram as labels, and new elements are created to mark changes of balance holder.
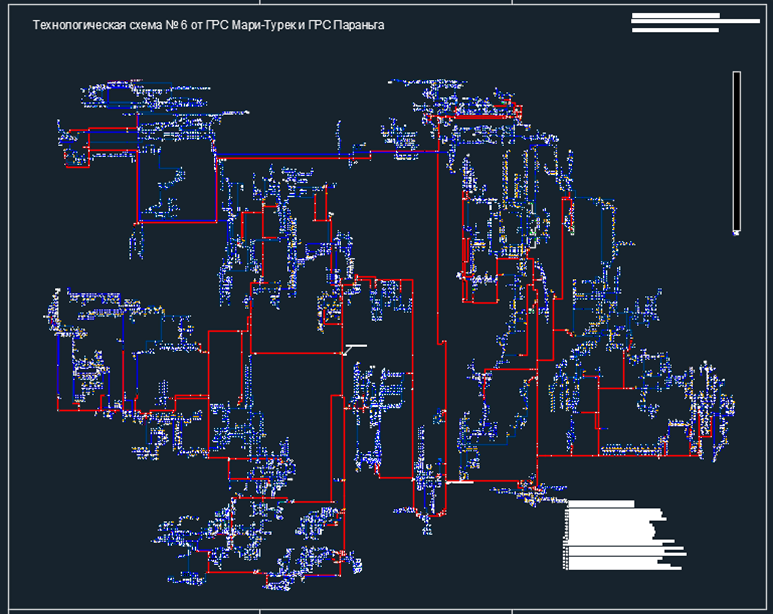
A diagram produced with the module consists of the same elements as a scaled diagram on the map. To meet the requirements of GOST 70107-2022, we export the diagram to DXF format. The export uses the same DXF export configuration templates, which make it possible to set up the correspondence between the graphic elements of the DXF drawing and the ZuluGIS layers.
Conclusion
We sincerely thank the Politerm team for their professionalism and for creating such an important product. The ZuluGaz Process Flow Diagrams module has not only simplified our workflows but also helped us comply with the new requirements. It is a tool that makes production and operational tasks more accessible and efficient.
Thank you for your work and your contribution to the development of GIS for utility companies.
See also: The "Process Flow Diagram Construction" module
— 06/21/2026 04:32:30 pm