


Thermogram analysis
 ZuluThermo Online Help «Thermogram analysis»
The purpose of thermogram analysis
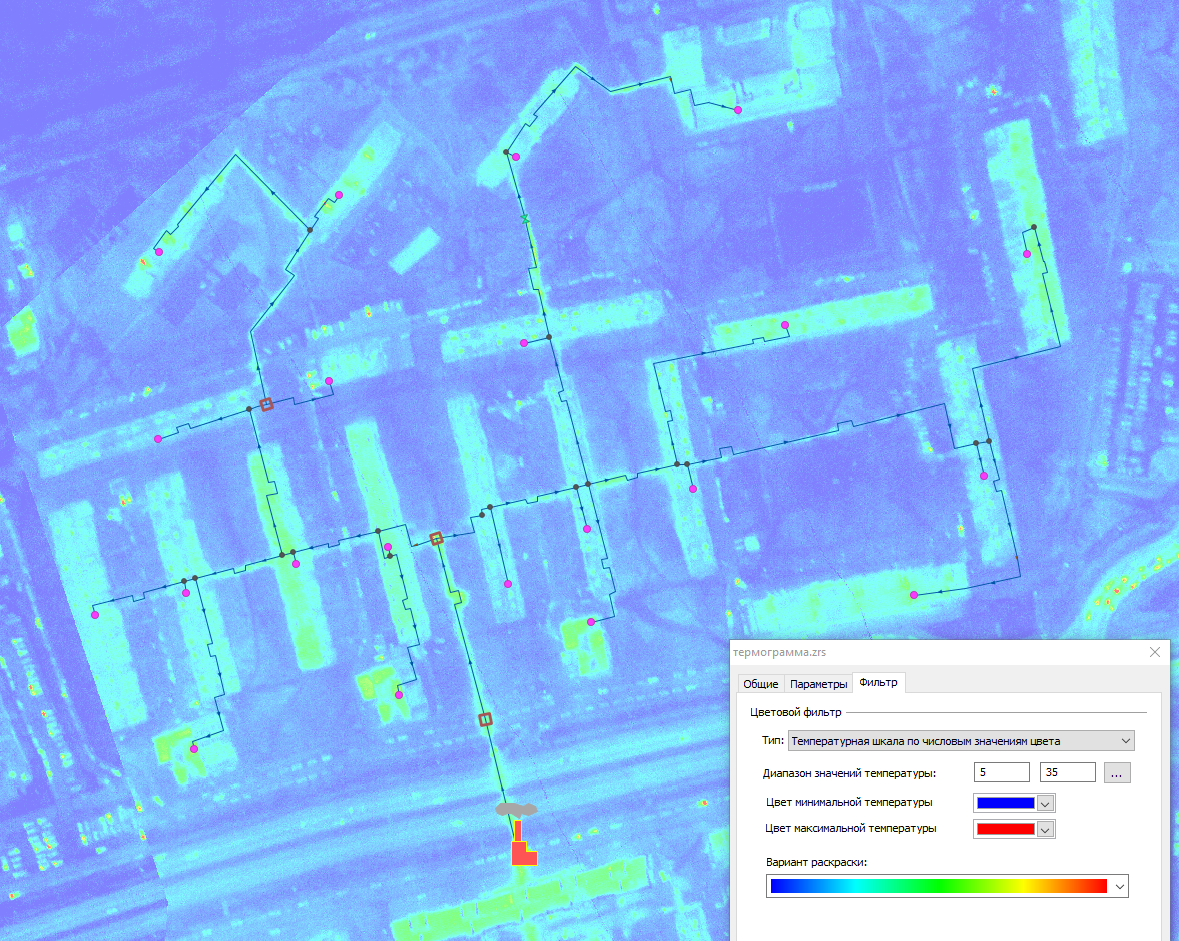
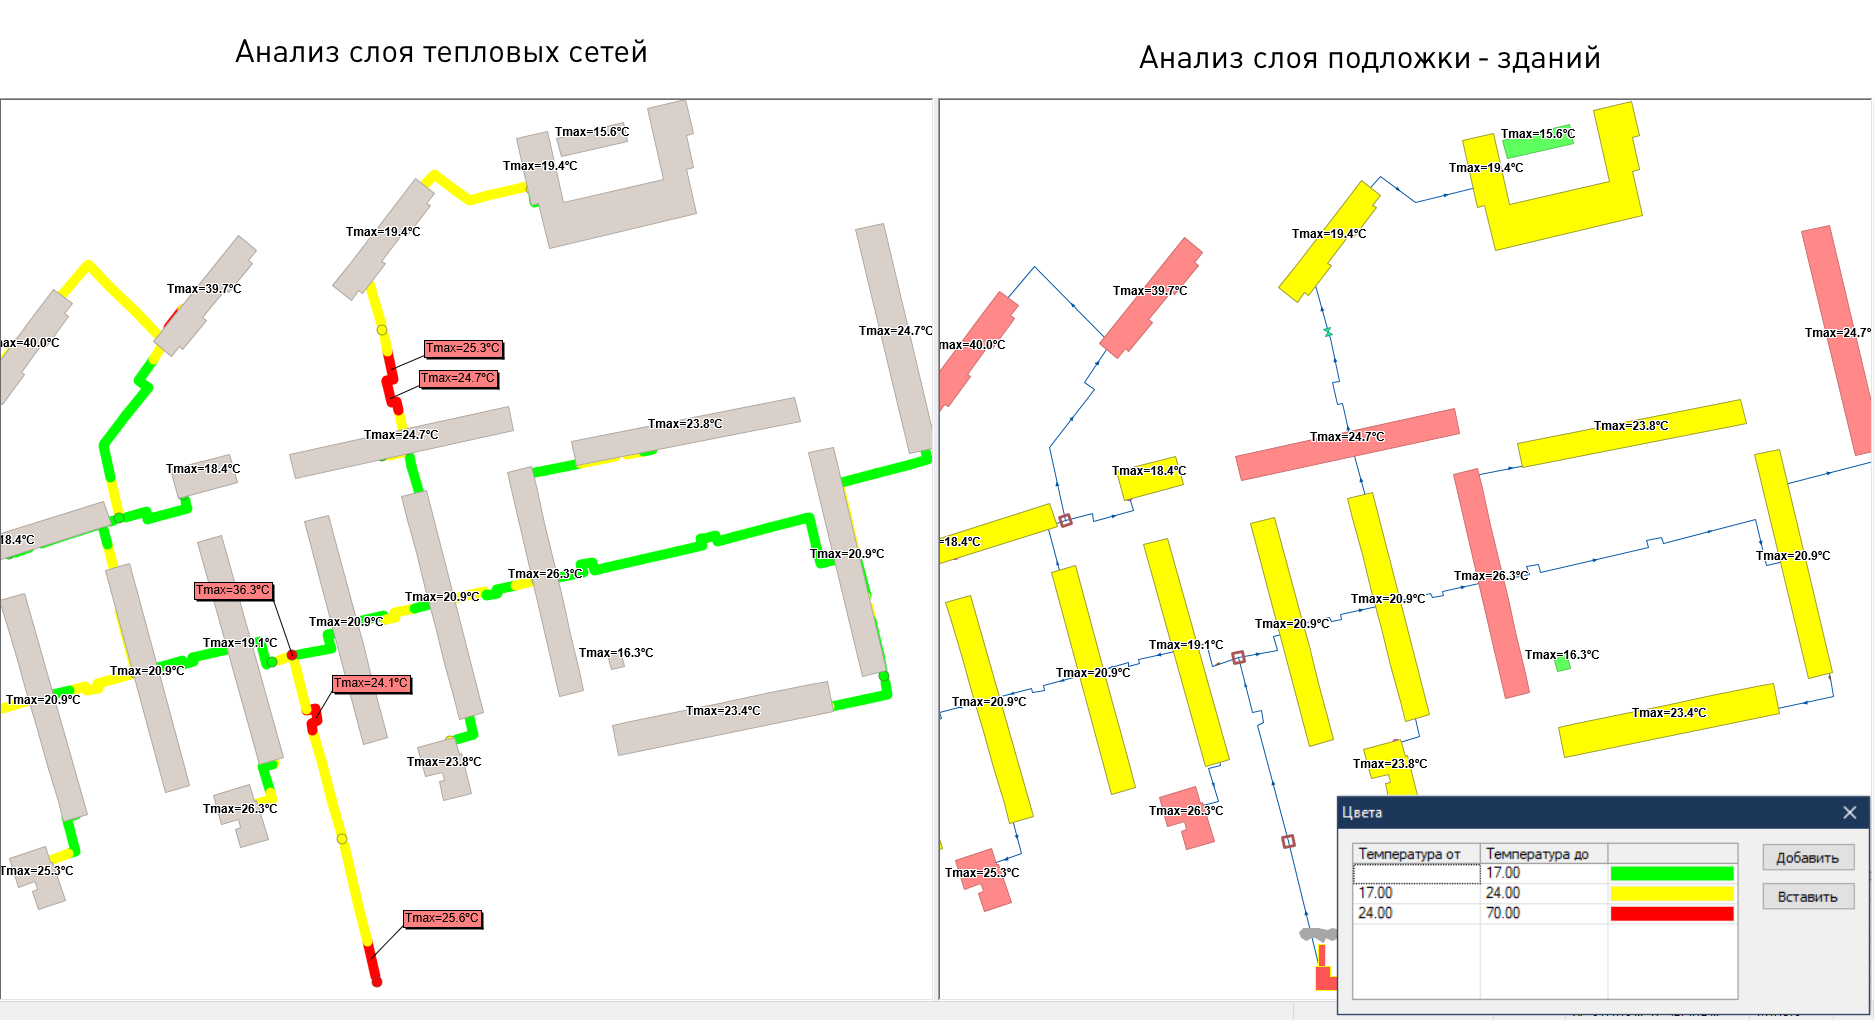
The analysis of thermograms is used to determine the level of heat loss in heat network pipes by analyzing the superimposition of a network diagram onto a thermal image. A thermogram is a raster image obtained as a result of a thermal imaging survey.
Each pixel of the raster image contains a temperature value. To determine the level of heat loss, a thermogram is scanned along each pipe of a heat network, and the pipe is classified according to the level of heat loss. The results are saved to a layer database in a clear graphical form.
Thermogram analysis enables users to complete the followings tasks:
- Determine abnormal areas with high heat loss caused by insulation defects or hidden leaks of a heat transfer fluid
- Find the exact location of damaged pipes
- Perform a comparative analysis of heat losses
- Determine the real location of steam network objects, particularly pipes with missing or unreliable documentation
- Develop measures to modernize a heating system in order to increase the energy efficiency of heat networks
- Review the execution and effectiveness of measures taken to restore the state of thermal insulation
The video shows an example of working with thermograms